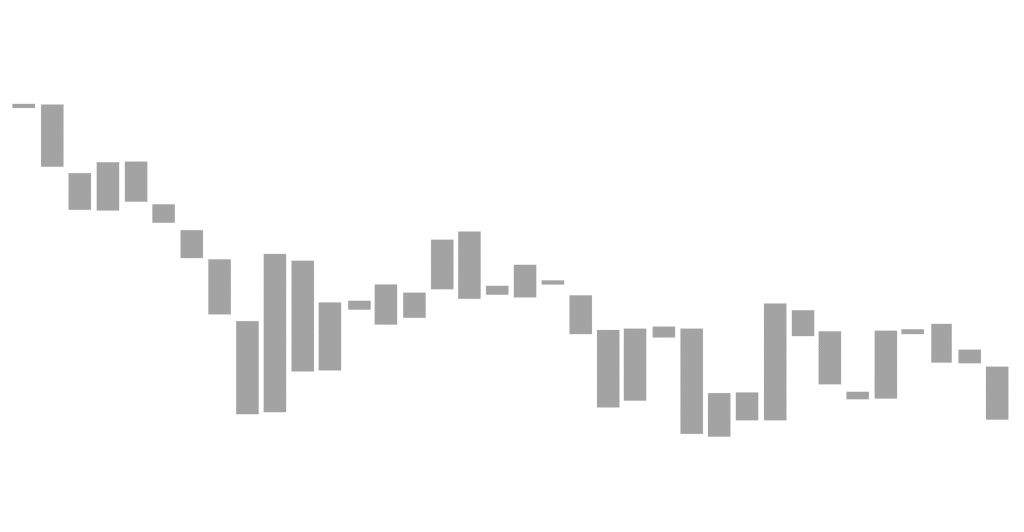
Attempt Two – Python code that allows users to analyse historical stock price data using the yfinance library. The code calculates the start and end dates for the desired historical data. It sets the end date as the current date using datetime.date.today(), and the start date as six months prior to the end date using datetime.timedelta(days=6 * 30). Using the yf.download() function from the yfinance library, the code attempts to fetch the historical price data and proceeds to calculate the weekly high and low prices using the resample() function on the close prices.
The resulting weekly highs and lows are stored in separate variables. The code retrieves the current week’s high and low prices by accessing the last elements of the weekly highs and lows arrays.
Next, the code calculates the average percentage difference between the high and low prices for each week. It subtracts the lows from the highs, divides the result by the lows, and multiplies by 100.
The average of these percentage differences is stored in the avg_percentage_diff variable. The code retrieves the current share price, the highest price for the current week, and the lowest price for the current week. It then calculates values based on the average percentage increase and decrease difference.
The theory is that regardless of shares going up or down, I should be able to ‘predict’ the short increases and decreases along its path.
PYTHON shares.txt
